Financial planning and analysis staff are usually overburdened in the task of managing all the data that keep the budgets rolling, let alone the rising demand for them to present reports in visually appealing ways. It’s a big job to aggregate all the data into a master spreadsheet and then sift through it for the most relevant and compelling bits to create engaging financial reports.
Most non-profits don’t even get to the analysis part because of all the work that goes required to even get to that stage. This means that many organizational leaders don’t give their own numbers a good hard look every month. If you aren’t managing the books yourself, the numbers are obscure and hard to sift through. The best way to alleviate some of this pressure and rise to the challenge of having accessible visualized financial reports is by investing in budgeting software.
Where is your money?
Financial reports often get mixed in the tall pile of reports waiting on a non-profit manager’s desk each month. It’s easier to ask the management for a summary, which often means that important information goes unnoted, like excess cash sitting in accounts receivable. This is just one example of how money gets lost in the process of taking care of a company’s complex finances. It’s not the result of someone failing to do their job, but rather the shortcomings of antiquated paper processes that make it hard to share crucial information. Budgeting software is universally accessible to all levels of management, saving everyone from shuffling papers around and losing important information in the mix.
Visualizing financial reports
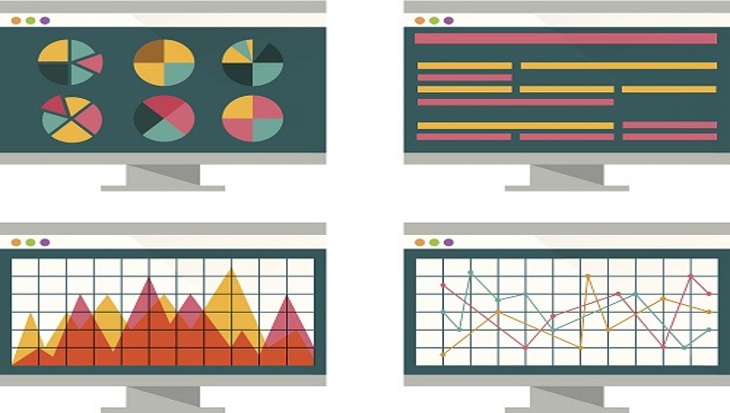
A picture really can say a thousand words, and not just words but numbers too. Data visualization is one of the fastest growing business trends, allowing companies to make use of the massive amounts of information they have stored on their servers. When you use budgeting software to manage your business finances, you can automate the information that gets cast into easy-to-read visualizations. Not only will the boss not miss the relevant data, but they’ll have it served to them in bite-sized pieces that are easy to digest. Then it can be used in casting a vision for the future. Financial reports don’t have to be boring documents that only the highly trained people can make sense of. By visualizing financial data you bring more people into the light. This includes not only the organization’s employees but investors and donors too. The more transparent the non-profit is, the more donors are willing to spend when they know where their money is going. Transparency is achievable partly through visualizing your financial reports.
Budgeting software allows you to have all your information in one place through which every authorized user can access from anywhere. It is completely secure, and often more so than the spreadsheets you have saved on your local servers. Financial reports are for more than having things buttoned up during tax season, but should be a powerful tool for change. If you can incorporate them into the culture of your organization as such, you are sure to see amazing things happen! Request a demo with our experts at Questica to learn more about how our tools can be easily integrated into your processes.