Questica makes it a priority to work alongside our customers to have a better understanding of the budgeting challenges your organizations face. Working with our customers means we don’t just provide technical support, but often explore your ideas and requests to ensure Questica’s suite of products remains the very best solution for your budgeting needs.
As a result of working with our customers, we’re happy to release some new and highly-requested features in Questica OpenBook, our data visualization solution.
Google Analytics Integration
One of the most requested features for OpenBook is the ability to track your site visitors: Who’s visiting? How long do they stay? Where are they from? By integrating with the free Google Analytics service, you can now track the results of your marketing efforts to promote your transparency site. When you register your site with Google Analytics, you are given a tracking ID number. By plugging this ID into the Administration → Settings → Integrate tab, you’ll be instantly connected and can start tracking site visitor data.
Learn more about Google Analytics.
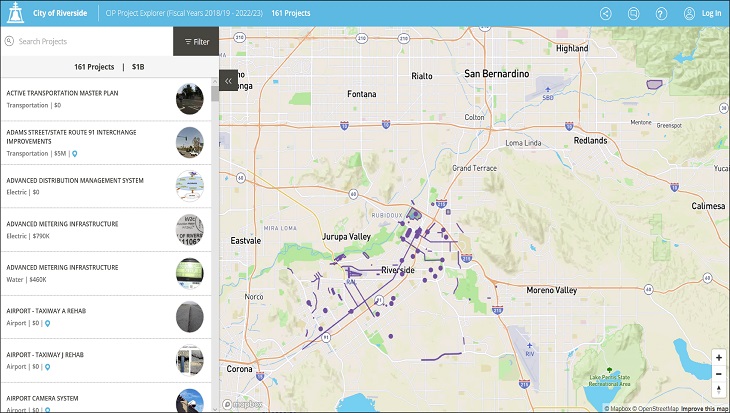
The Map Explorer
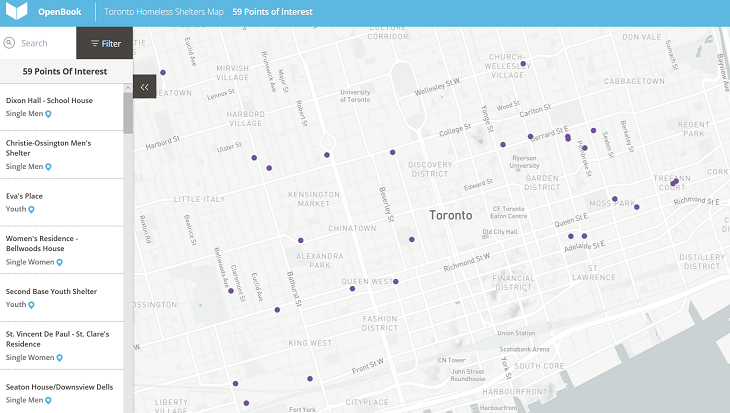
With the success of our Capital Project Explorer, customers have been asking for a more general-purpose way to show maps in OpenBook. This new visualization can display any OpenBook dataset on a map, as long as that dataset has some kind of geographic data in it – including street addresses, latitude/longitude points, and even full geometry like lines and polygons.
Take a look at this example map of Toronto homeless shelters to see it in action.
Increasing transparency and improving citizen engagement are significant goals for all local governments. These new OpenBook features will help you learn more about what’s working on your transparency website, as well as provide new options for displaying Capital Project information.
If you’d like to learn more about these new features, please reach out to our Customer Success team and we’ll be happy to help. Supporting documentation will also be available on help.questica.com.
For more information about how data visualization read our blog on how you transform your interactive visuals to engage citizens and increase government transparency.